RECESSION, INFLATION & RATE HIKES, OH MY!
THE SUM OF ALL FEARS
Jonathan R. Blau – April 26, 2022
2022 has brought with it a combination of two concurrent fears, each of which causes wide-spread panic on its own:
1. The fear of economic and personal financial deterioration; and
2. The existential threat perceived from fear of the Ukrainian war spreading to NATO countries and involving the United States (nuclear war, WW III, etc..).
The last time two such fears converged was during the Pandemic as outlined in our March 2020 article, THE GREAT 2020 PANICDEMIC! https://www.fusionfamilywealth.com/blog/the-great-2020-pandemic Investor anxiety levels appear to be running about as high now as they were then. Fusion’s dominant role is to counsel investors on making rational money decisions under conditions of uncertainty – meaning ALWAYS making such decisions, since certainty does not exist anywhere as a condition in nature.
Experiencing feelings of anxiety in response to these perceived threats is perfectly normal and we should not suppress such feelings. However, it is critical to NEVER reflect these fears in our portfolio strategy by engaging in market timing, portfolio and sector shifting or any other destructive investor behavior that involves reacting to these fears by altering long-term portfolio composition to reflect short-term current events.
THE FEARS
• RISING INTEREST RATES – The federal reserve began raising interest rates this year to begin the thirteenth interest rate-hike cycle since 1954. Investors fear that rate-hikes may derail economic growth and cause a deep and protracted stock market decline.
• INFLATION – Investors fear that rising prices (inflation is at a 40-year high) may curtail economic growth and contribute to a deep and prolonged stock market decline. They feel the need to alter their portfolio composition to increase exposure to perceived inflation-hedges such as gold.
• RECESSION – Investors fear that the combination of interest rate-hikes and inflation will lead to a condition known as stagflation (a simultaneous increase in the cost of living and decrease in economic growth). Recession fears are exacerbated further due to the recent inversion of the yield curve (when the 2-year treasury yield moved ever-so-briefly higher that the 10-year treasury yield on April 1). Such a condition has, at times in the past, presaged a recession.
THE FACTS
• RISING INTEREST RATES – There have been 12 rate-hike cycles since 1954. The cycles have lasted 3 years on average (meaning that the fed should be done raising rates at or about year-end 2024). The average annual return for the S & P 500 has exceeded 8% per year, historically, for the 3-year periods.
BOTTOM LINE – The market’s returns have been strong during rate-hike cycles and only had negative returns in one of the 12 cycles since 1954 - the 1970s cycle. For a more detailed look at these cycles please see our January 26, 2022 newsletter: THE SKY IS FALLING – NOT! https://www.fusionfamilywealth.com/blog/the-sky-is-falling-not
• INFLATION - Current inflation, recently reported to be running over 8% year-over-year, is very real and palpable. In the late 70s inflation was about 20% (2.5 times higher than current readings). Our economy and stock market have not only withstood high inflation historically, but both have always gone on to new highs (IN THE CASE OF THE S & P 500 – new highs in both price and cash dividend levels). IN 1980, the last time inflation peaked, the S & P 500 was about 100 and the cash dividend was $5.65. A $1 million investment was paying cash dividends of $56,500. The value of that $1 million, as I type this is, approximately $43 million. The cash dividend on the initial million is currently $600,000! The oft-touted “inflation hedge,” gold was 800 per oz. in 1980 and today is about 2,000 (a 2.5-fold increase). $1 million invested in gold is today worth about $2.5 million and still offers ZERO cash dividend. One is likely to find a better inflation hedge collecting comic books than gold. The Consumer Price Index (measure of inflation) was 76 in 1980 and today is 288 (increasing under 4-fold). So, it takes about $225,000 to buy what the initial stock dividends of $56,500 bought in 1980. The current cash dividends on that initial investment pay about $600,000 (the equity investor can now buy three times as many goods and services at today’s higher prices than they did in 1980). The equity investor’s next generations also benefitted mightily as the increased value of the stocks not only protected against inflation but actually increased our standard-of-living 10-fold as we would only need $4 million to buy what $1 million bought in 1980, but we have $43 million. Mainstream stocks (i.e., S & P 500) are arguably the best inflation hedge ever created by humankind.
• RECESSION - We have had 13 since WW II. According to research from The Hartford Funds, the S & P 500 gained just under 4%, on average, during these recessions. Further, while past inversions of the yield curve are alleged to “forecast” a recession, such recessions began as long as over two years after the curve inverted. For a more detailed discussion of inverted yield curves and recessions please see our July 21, 2019 newsletter: THE IMPENDING RECESSION & INVERTED YIELD CURVE https://www.fusionfamilywealth.com/blog/the-impending-recession-inverted-yield-curve
SHOULDN’T WE JUST WAIT FOR THE “DUST TO SETTLE”
BEFORE ADDING TO INVESTMENTS?
BEHAVIORAL INVESTMENT COUSELOR WARNING:
MARKET TIMING MAY BE HAZARDOUS TO YOUR WEALTH!
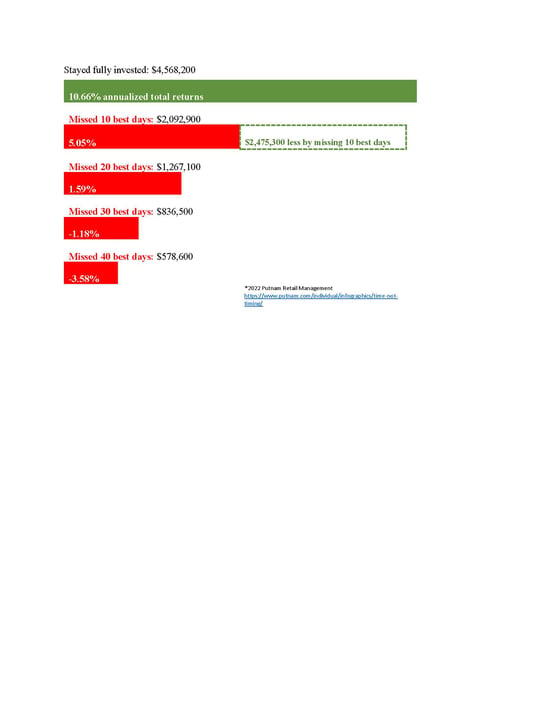
The stock market was open for just under 3,800 trading days for the 15 years ending in 2021. The annualized return for the S & P 500 during the period was 10.66% / year. Investors who missed the 10 best days of the 3,800 (about one-quarter of 1% of the total period) earned less than half (5.05% annually versus 10.66%).
No one should be faulted for feeling a very human impulse to try and get out before something bad happens, as that impulse is innate in all of us. But it’s just that: an impulse, because getting out is at best half a strategy. In the absence of a strategy for re-entry, one will just wait until they feel the impulse to get back in. The odds that these two impulses, acting in sequence, will yield results better than the market return are prohibitive to the point of impossibility. Human nature cannot absorb this and so it will repeat these mistakes always and often in the absence of an empathetic, but tough-loving behavioral investment counselor – please pardon the shameless plug!
The highest probability of investment success is achieved by MAXIMIZING ONE’S TIME IN THE MARKET AND BY ELIMINATING ANY ATTEMPTS AT TIMING THE MARKET!
By staying fully invested over the past 15 years, an investment of $1,000,000 would have earned $2,475,300 more than someone who missed the market’s 10 best days
. 
THE STOCK MARKET (i.e., S & P 500) IS SUBJECT TO FREQUENT, OFTEN SIGNIFICANT DECLINES
• Since 1980, the average annual decline has been 14%
• During this period, an average decline of 30% occurred about one year in 5
• Twice since 1980. (in 2000-02 & 2007-09), the S & P 500 has about halved in value!
We also observe, most critically, that during this same period the S & P 500 came into 1980 at about 108, went out of 2021 at 4,766 and produced an average annual compound return in excess of 12%. How can investors begin to hold these two contradictory realities in their heads at the same time? What renders both statements true is the healing power of time. Since 1926, there have been more than 1,100 rolling 12-month periods (i.e, from Jan. ’26 - Dec. ‘26, then from Feb. ’26 – Jan. ’27, and so on…). This is a much more statistically meaningful period than simply looking at the close to 100 annual periods from ’26 – today). We observe the following regarding the percentage of the rolling periods that produced positive returns:
1-Year rolling periods – 75+%
3-year rolling periods – 84+%
5-year rolling periods - 88+%
10-year rolling periods – 94.5%
The returns for the rolling 15 and 20-year periods were positive nearly 100% of the time!
INVESTORS HOLDING BACK ON INVESTING CASH THAT IS AVAILABLE FOR INVESTMENT is one of the most insidious forms of market-timing. THE ODDS ARE 3-TO-1 AGAINST THAT BEING A SUCCESSFUL STRATEGY IN ONE YEAR. IN 5 YEARS, THE ODDS OF ARE 7-1 AGAINST YOU!
Investors with less than 3-5 year time horizons should not be investing in equities to begin with. INVESTORS WITH TIME HORIZONS EXTENDING 5-10 YEARS, WHO CANNOT TOLERATE EVEN THIS MINISCULE LEVEL OF AMBIGUITY -- THE CHANCE THAT 1 OF 8 OR 9 PERIODS MIGHT NOT YIELD A POSITIVE RETURN -- CAN LIKELY NEVER BE SUCCESFUL EQUITY INVESTORS.
IT’S NEVER THE KNOWN UNKNOWNS THAT GET YOU!
As Donald Rumsfeld described his job as one of always dealing with the unknown, so I describe our job at Fusion. Rumsfeld broke the unknown down into two categories: known unknowns and unknown unknowns or black swans, “and it isn’t the known unknowns that get you.” We agree. Today’s investor fears are based on 4 of the greatest known unknowns there are:
1. Inflation – we know we have it, we don’t know how high it will go or when it will end;
2. Interest rate hikes – we know they are going up. We don’t know how long they will be going up or what level they will reach;
3. Recession – we know that we have had one about every 6 years since WW II. We don’t know when the next one will begin, how long it will last, how deep it will be and when it will end;
4. War – we know there is a major conflict. We don’t know how it will progress, which parties may get brought into it or when and how it may end. Please see Fusion’s March 2022 article, 5%, 22 Days, 1.5 Months https://www.fusionfamilywealth.com/blog/5-22-days-1.5-months for a more detailed view on this topic.
r a more detailed view on this topic.
It is critical to recognize that market participants, as a whole, generally have a pessimistic bent regarding their response to bad news. As such, the market has likely priced most of these fears (and likely overpriced them) into current valuations. When known unknowns appear, they are the long-term investors’ friend. The more there are simultaneously, the more likely we are to be at an historically opportune time to add funds to the great companies of America and the world (i.e., S & P 500) at substantial discounts to their long-term enduring values. Human nature believes that when prices of stocks are skyrocketing -- particularly when the surge in prices is evidenced in an increasingly narrow space, like dotcom and tech stocks in the late ‘90s – that is the best and safest time to add funds. In those environments, when prices rise inexorably day-in and day-out for years on end and the only investor fear is the fear of missing out (FOMO), that is when the greatest danger likely exists!
TOP 6 REASONS INVESTORS SHOULD FEEL PARTICULARLY OPTIMISITIC UDER PRESENT CONDITIONS
1. The first two months of 2022 (through February 28) marked the 5th worst start to a year in the market’s history. The average return for the market for the 10 months (March -December) following the 9 worst starts was over 28%. From current levels, a 24% increase by year’s end would be needed to reach the average return during these periods.
2. According to the American Association of Individual Investors (AAII) bullish sentiment/optimism (expectations that stock prices will increase over the next 6 months) two weeks ago fell to 15.8% – a level not seen in 30 years (14% on Sept. 4, 1992). The S & P 500 was about 400 back then! The market is up dramatically (over 10 times) since then!
3. In the nearly 4 decades since the AAII survey began being published, whenever bullish sentiment was lower than 28%, THE AVERAGE GAIN OVER THE FOLLOWING 6 MONTHS WAS OVER 8%. Sentiment has been below 20% for the past two weekly surveys.
4. The average annual return for the S & P 500 during the 12 previous rate-hike periods exceeded 8%. Therefore, from current levels, the market would need to increase by about 20% by year-end to reflect the average during these cycles.
5. According to JP Morgan, US household net worth stands at a near record $163 trillion. Importantly, $15 trillion of that is in money market funds/cash. Investors are still terrified of stocks 13 years into the one of the longest and strongest bull markets in history. SECULAR BULL MARKETS HAVE NEVER ENDED WHEN THE PREVAILING SENTIMENT IS SUCH, BUT RATHER WHEN THE ONLY FEAR IS OF MISSING OUT ON A SPECTACULAR BUBBLE-LIKE, GREED-BASED, EUPHORIC BUYING FRENZY LIKE THE DOTCOM BUBBLE!
6. The combination of four of the greatest known-unknowns, near-record US household cash positions, near-record low household debt burden as a percentage of disposable income (in an economy driven nearly 2/3 by consumers) and near-record low investor optimism is one of the greatest cocktails I have ever witnessed in real-time -- arguing, screaming to all who seek to preserve and grow wealth, to embrace long-term equity investing and all of its miracles like never before.
Bull markets are born on pessimism (March 2009), grow on skepticism (the past 12+ years), mature on optimism (not present yet in cycle) and die on euphoria (likely years away).
……..Sir John Templeton
Until our next dose of behavioral investment counseling “vitamin C,” stay calm and carry on. Your wealth and your family’s long term financial future are depending on it! Have a wonderful summer.
